KANBAN
Understanding Kanban in Project Management
Kanban is a visual workflow management method that originated in manufacturing and has been widely adopted in Agile project management. It provides a framework for managing tasks, improving team efficiency, and ensuring work flows smoothly from initiation to completion.
What is Kanban?
Kanban is a Japanese term meaning “signboard” or “visual signal.” In project management, it refers to a system that uses visual cues, such as cards on a board, to represent tasks. The primary goal of Kanban is to optimize workflow, limit work in progress (WIP), and enhance overall productivity.
Principles of Kanban
- Start with What You Do Now: Implement Kanban on top of existing processes without major disruptions.
- Pursue Incremental Change: Encourage small, continuous improvements rather than drastic changes.
- Respect Current Roles and Responsibilities: Use Kanban to enhance existing team structures.
- Encourage Leadership at All Levels: Foster decision-making and leadership throughout the team.
Elements of Kanban
- Kanban Board: A visual representation of the workflow with columns representing stages such as “To Do,” “In Progress,” and “Done.”
- Kanban Cards: Visual markers representing tasks or work items.
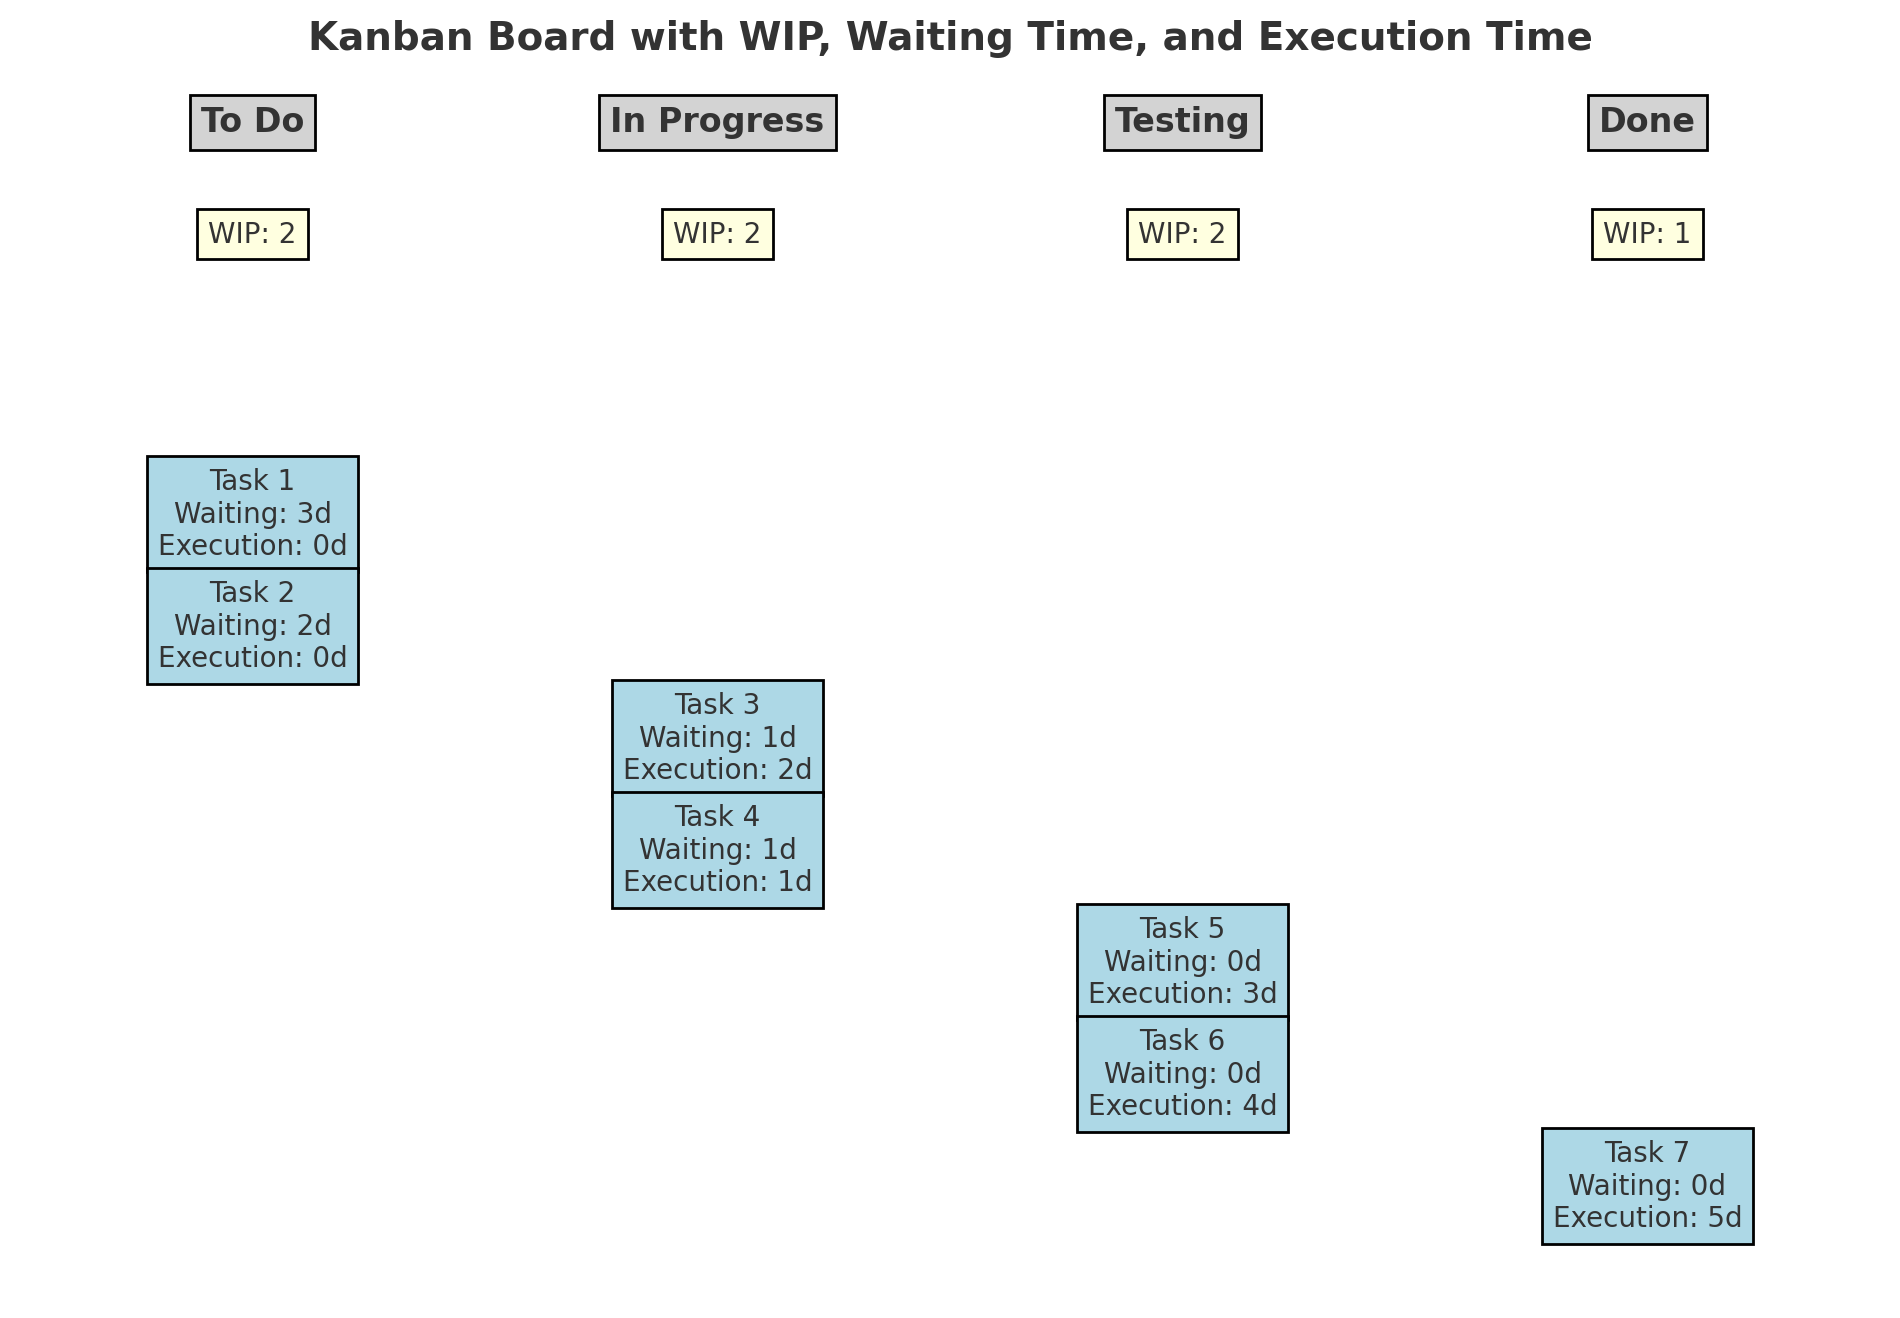
- Work-In-Progress (WIP) Limits: Caps on the number of tasks in each stage to prevent overload.
- Cycle Time: The time taken for a task to move from start to finish.
- Lead Time: The total time from when a task is requested to when it is completed.
Steps in a Kanban Workflow
- Visualize Workflow: Use a Kanban board to map out stages of the workflow.
- Set WIP Limits: Determine the maximum number of tasks allowed in each stage to maintain focus.
- Manage Flow: Monitor tasks and identify any bottlenecks.
- Make Policies Explicit: Clearly define rules for moving tasks between stages.
- Implement Feedback Loops: Conduct regular reviews to refine processes.
- Improve Continuously: Analyze data to identify areas for improvement.
Setting Work-In-Progress (WIP) Limits
To set effective WIP limits:
- Assess team capacity and historical data.
- Set limits for each stage of the workflow based on the team’s ability to complete tasks.
- Adjust limits based on observed bottlenecks or inefficiencies.
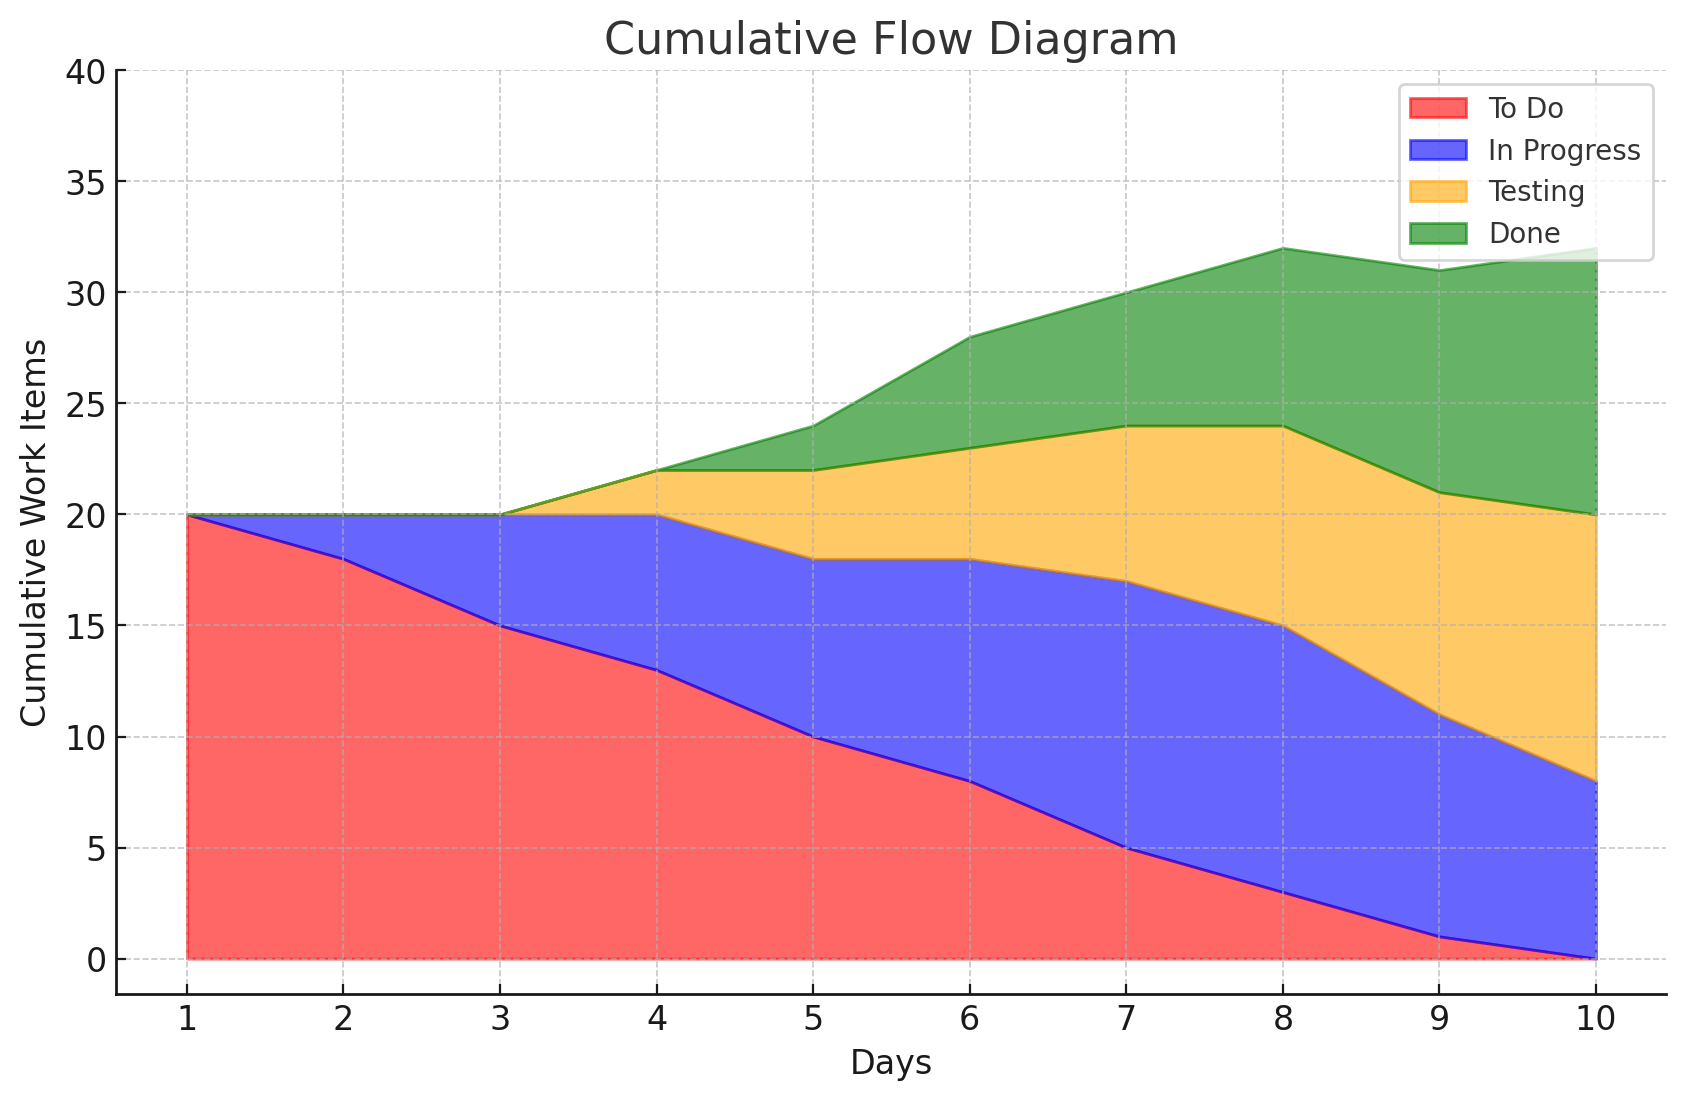
Measuring Cycle Time and Lead Time
- Cycle Time: Tracks how long a task spends in active work stages (e.g., “In Progress” to “Done”).
- Lead Time: Measures the total time from task creation to completion (e.g., “To Do” to “Done”).
Difference Between Cycle Time and Lead Time
- Cycle Time focuses on task execution.
- Lead Time includes both waiting and execution time.
Practical Examples of Kanban in Project Management
Example 1: Software Development
- Scenario: A development team uses Kanban to manage feature delivery.
- Workflow: Stages include “Backlog,” “Development,” “Testing,” and “Deployment.”
- Usage: WIP limits ensure developers focus on finishing tasks in “Development” before starting new ones, preventing bottlenecks in “Testing.”
Example 2: Marketing Campaign Management
- Scenario: A marketing team uses Kanban to plan and execute campaigns.
- Workflow: Stages include “Planning,” “Content Creation,” “Approval,” and “Published.”
- Usage: WIP limits in “Approval” ensure that the review team isn’t overwhelmed, speeding up campaign delivery.
Example 3: IT Support
- Scenario: An IT support team uses Kanban to track service requests.
- Workflow: Stages include “New Tickets,” “In Progress,” and “Resolved.”
- Usage: Monitoring the “In Progress” stage ensures tickets are addressed efficiently, reducing response times.
Case Study: Kanban in a Project in Thailand
Project: Digital Transformation for a Retail Company
- Scenario: A retail company in Thailand adopted Kanban to manage a digital transformation project involving website redesign and system integration.
- Workflow: Stages included “Requirements Gathering,” “Development,” “Testing,” and “Implementation.”
- Challenges: Bottlenecks in “Testing” delayed progress.
- Solution: WIP limits were applied to “Development” to prevent overwhelming testers. Daily stand-ups and retrospective meetings addressed issues quickly.
- Outcome: The project was delivered on time, with improved collaboration and transparency.
Example Kanban Board
Conclusion
Kanban is a versatile and powerful framework for managing workflows in Agile project management. By visualizing work, setting WIP limits, and continuously improving processes, teams can enhance productivity and ensure timely delivery of projects. Whether it’s software development, marketing, or IT support, Kanban provides a flexible approach to achieve better outcomes.